Building Alert Pro – All current building applications in your area at a glance
Discover building applications now


by
Dr. Stefan Fahrländer & Manuel Lehner, Fahrländer Partner AG
Academic support: Prof. Dr. Michael Gerfin, University of Bern

The real estate surveys of HEV Switzerland and FPRE provide a spatially and temporally differentiated picture of sentiment in the Swiss real estate market. Experts from all parts of the country give their assessments of past and future market developments. The indices presented condense these expert opinions and make them available to the interested public in the form of time series. The questions relating to prices and future developments are evaluated, since the price, as the result of the interaction between supply and demand and especially its forecast, is at the centre of interest.
The following series are provided:
The HEV Switzerland real estate survey was conducted for the first time in 1981 as an expert survey on the development of 15 key variables of the Swiss real estate market. Today, the survey comprises around 70 questions on various real estate-related indicators.¹
The HEV survey is carried out annually in the 4th quarter. Depending on the year, the survey reached between 80 and 150 participants and covers the densely populated part of the German-speaking Mittelland arc. The Lake Geneva region, the Jura, the Alps, and southern Switzerland are only weakly or not covered.
The FPRE real estate survey has been conducted semi-annually since summer 2008. Until 2011, it comprised ten questions on demand and price developments in the most important market segments of the Swiss real estate market. In summer 2012, the survey was slightly adjusted and has since comprised twelve questions on past and expected price developments in six market segments. The survey reaches around 650 participants and covers all regions of Switzerland.²
A comparable measure for sentiment in specific markets is provided by SECO’s consumer sentiment survey.³ Until 2007, nine questions were asked, and since 2008 there have been eleven. The two additional questions mainly concern the future.
Each question is converted into an index by assigning the following values: very positive assessments = 2, positive = 1, neutral = 0, negative or very negative = -1 and -2. The overall consumer sentiment index is then composed of the three questions “past economic development”, “past financial situation” and “expected financial situation”. Since 2007, a new index has also been calculated to improve predictive power, based on the questions “expected economic development”, “development of unemployment”, “expected financial situation” and “expected situation: savings/debt”.
For the present price expectation indices for real estate, only future-oriented questions are evaluated.
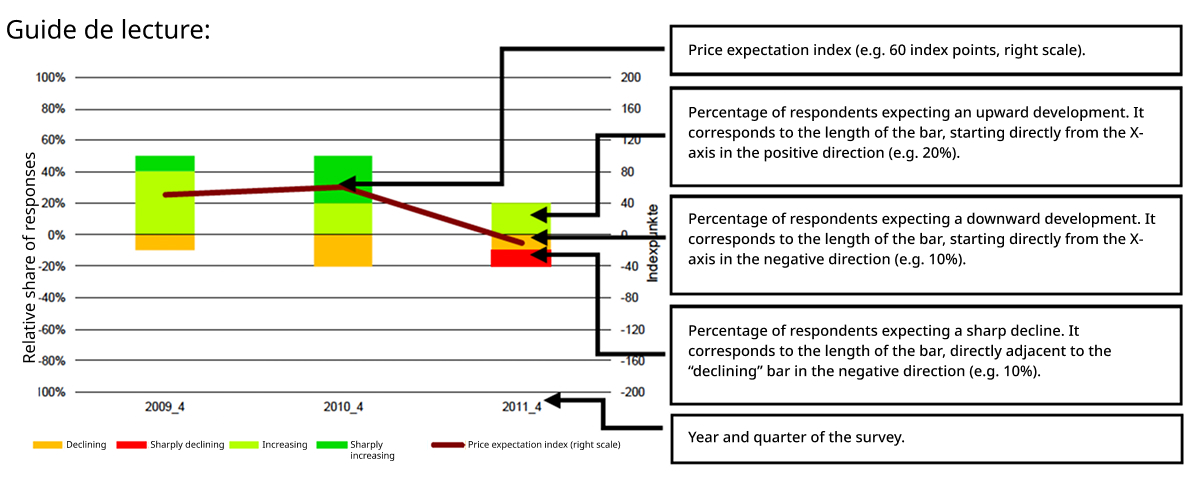
In both the HEV and FPRE real estate surveys, the experts surveyed assess past and expected price developments using the attributes “sharply declining”, “declining”, “stable”, “increasing” and “sharply increasing”. Based on the assessments of the future-oriented price questions, six price expectation indices are calculated.
The attributes are assigned a value between -2 and +2 (stable = 0), analogous to consumer sentiment.
The price expectation indices are first calculated for each of the 106 MS regions.⁴ Survey participants indicate for which MS regions they provide their responses. There are two types of participants:
The calculated index can take values between -200 (all respondents in the MS region expect sharply declining prices) and +200 (all expect sharply increasing prices) and is calculated as follows:
𝐼𝑛𝑑𝑒𝑥MS-region = 100 ∗ (−2∗weighted share “sharply declining” + −1∗weighted share “declining” + 0∗weighted share “stable” + 1∗weighted share “increasing” + 2∗weighted share “sharply increasing”)
The construction of higher-level aggregates requires the use of appropriate weights. The weights depend on what the index is intended to represent. For the present price expectation indices, the regions are weighted according to their relative market activity. Since this varies greatly by use, a specific weighting is defined for each type of use (see Table 1). This weighting is used at all times of aggregation in order to make time slices comparable. On this basis, any aggregates that can be formed from MS regions can be calculated.
Table 1: Weights for aggregating MS region indices
In addition to the price expectation indices per use (see section 2.1), combined indices for residential property and for investment properties are calculated:
The indices for the individual MS regions serve as the starting point. For the calculation of the combined indices at MS region level, the same weights are used as for the aggregation of individual questions (see Table 1). The residential property index, for example, is more strongly influenced by the EFH price expectation index in regions with high EFH market activity and low EWG market activity, and vice versa.
For the aggregation of the combined indices at FPRE region and Switzerland levels, the average of the sub-index weights is used. This results in a consistent set of indices at all levels of aggregation.
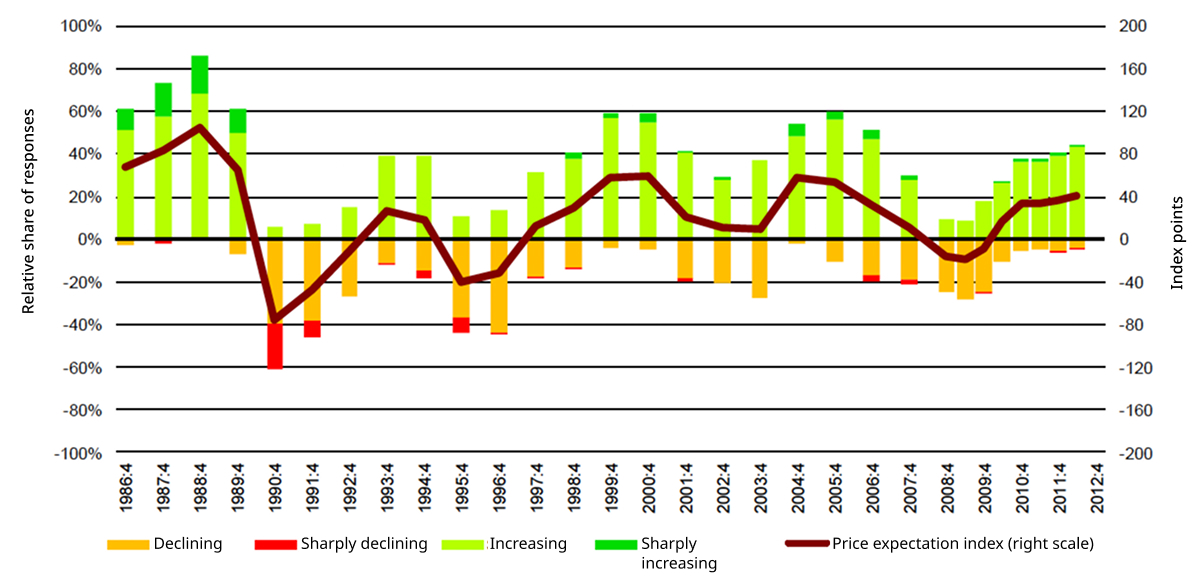
For the publication of the index series, two graphics are presented in addition to the index values (tables). The first graphic (Figure 1) shows the relative distribution of responses (left scale) as well as the price expectation index over time (right scale). The share of responses “stable” (=0) is not shown in the graphic.
Figure 1: Price expectations (example: condominiums)
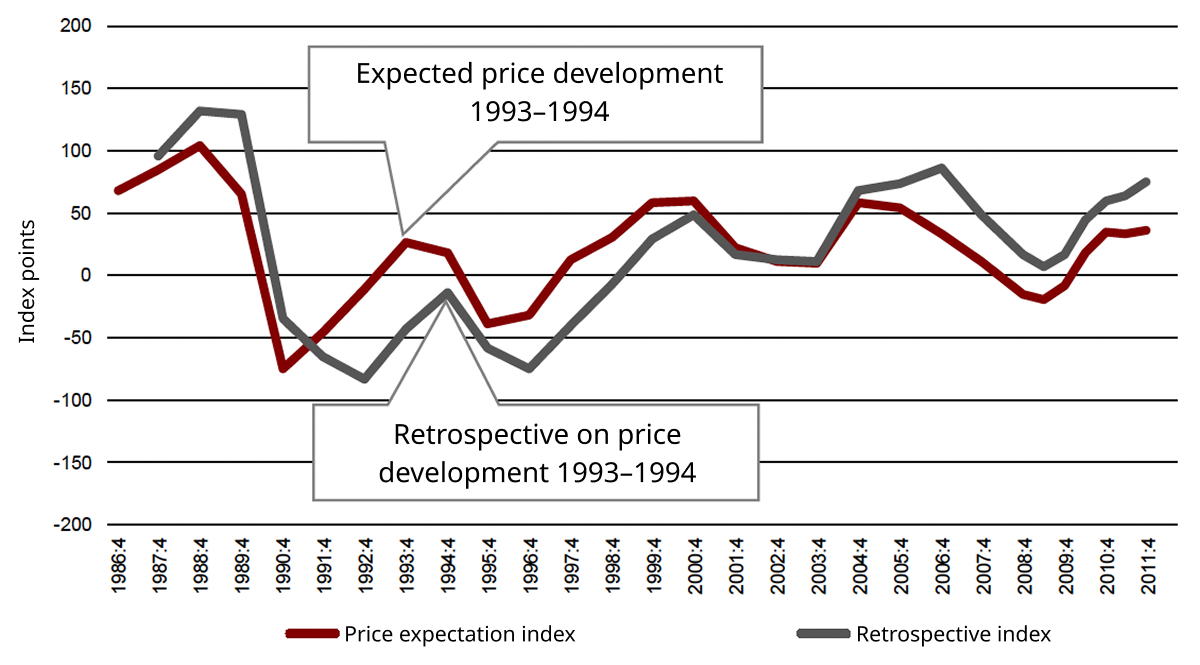
In a second graphic, price expectations at a given point in time are compared with the retrospective on price developments at the subsequent survey date. It is therefore examined whether the retrospective assessment of price developments coincides with the previously predicted expectation.
As Figure 2 shows, for a simple superposition of the two time series, two index values at different points in time must be compared. The example clearly shows that the expectation for the period 1993–1994 was much more accurate than the subsequent retrospective (Expectation: around 30 index points, Retrospective: around -15 index points).
Figure 2: Superposition of price expectation index and retrospective index
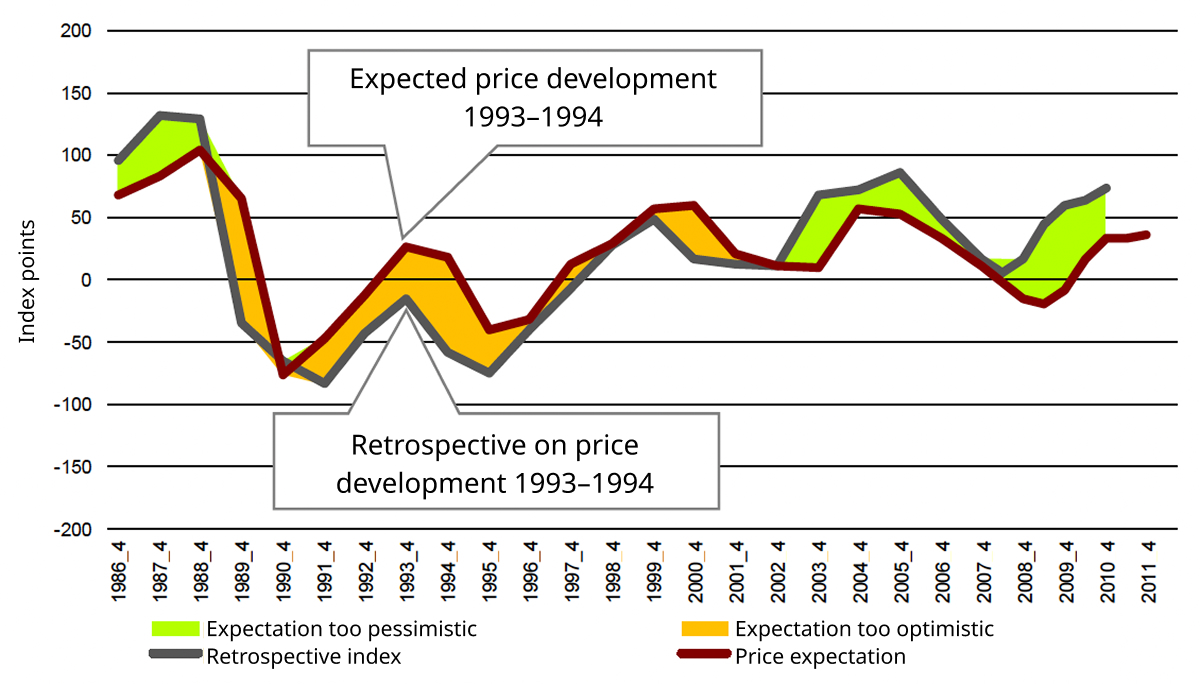
To compare expectation, retrospective and the difference between the two, the retrospective index is shifted back by one period (to the left) (see Figure 3). This allows expectation and retrospective to be compared directly for a given period. The gap between the indices provides an indication of the degree of over- or underestimation of price developments, or of the experts’ surprise regarding the observed dynamics of prices.
Figure 3: Comparison of expectation and retrospective
Fahrländer Partner updates the price expectation indices semi-annually, using the results of the spring survey in the 2nd quarter and the results of the autumn survey in the 4th quarter. The annual HEV Switzerland survey is included in the calculation of the 4th quarter indices.
The publication is in the form of a freely available Excel file. It contains the following data:
BFS (2012)
MS regions, Internet link (accessed: 8.5.2012): http://www.bfs.admin.ch/bfs/portal/de/index/infothek/nomenklaturen/blank/blank/msreg/01.html. Neuchâtel.
Fahrländer, S. and D. Matter (2011)
Cycles in the Swiss real estate market – Ed.: HEV Switzerland. Zurich.
Doytchinov, S. (2009)
Consumer sentiment index – measuring the non-observable. In: Die Volkswirtschaft: The magazine for economic policy. Ed.: Seco. 1/2-2009, pp. 44–46.
¹ Cf. Fahrländer and Matter (2011).
² Coverage in the Jura remains limited.
³ Cf. Doytchinov (2009).
⁴ For the concept of MS regions, cf. BFS 2012.
⁵ Weighted share: share of participants according to weighting type 1 / type 2 in the respective MS region.
⁶ Due to the spatial coverage mentioned in section 1.2, HEV data are published only at the Switzerland aggregation level.